


Statcast is a tool that MLBAM hopes will create metrics every fan can enjoy.
Baseball fans come in all shapes and sizes, from little kids who are just learning to love the game to older fans who have followed their favorite team for decades. When the Chicago Cubs won the World Series, multiple generations of fans were finally able to celebrate after more than a century without a title. Some fans get to experience multiple titles in a short period of time, like the San Francisco Giants of recent years, while others are still waiting for that first championship.
Along with their rooting interests, fans have a different level of engagement in their support of their favorite teams and players. Some fans just enjoy the atmosphere of a ballgame, the good time spent with friends at the ballpark or watching on TV. They might enjoy the optics of the game, like a pitcher with a terrific curveball or a hitter who hits mammoth home runs. When it comes to statistics, they aren't that interested. They just like watching the game.
Others enjoy watching the game and diving into the numbers. They want to know a hitter's average exit velocity or a pitcher's spin rate. They appreciate the Wins Above Replacement (WAR) metric that encapsulates a player's offense and defense into one number to reflect the value of that player.
Whatever your preference as a baseball fan, it's important to remember that we're all fans of the same game. There doesn't have to be a divide between the old-school fans and the new-school fans. I'm in the new-school camp that appreciates and enjoys looking at advanced metrics, but I enjoy going to games with friends who don't have any use for them. At a basic level, they might look at the scoreboard to find the hitter's batting average; I'm looking for their on-base percentage. We're watching and enjoying the same game, but seeing it just a bit differently and there isn't anything wrong with that. We all cheer with the same passion when a great play is made on the field.
Major League Baseball wants to appeal to every type of fan. One of the recent developments behind the scenes is a tool called Statcast that is slowly making its way into broadcasts. Statcast is a product of Major League Baseball Advanced Media (MLBAM) that was introduced two years ago. Three stat-savvy baseball fans who now work for MLBAM are hoping to create Statcast metrics that will appeal to all types of fans. Two of the three, Daren Williams and Mike Petriello, gave a presentation at the MIT Sloan Sports Analytics Conference recently to explain the current status of Statcast and where they expect to take it. A third, Tom Tango (not his real name), will speak at the SABR Analytics Conference in Phoenix next week.
If you're an old-school fan and have read this far, you may be getting weary when you read about analytics conferences. Don't. Williams, Petriello and Tango are working hard to make the information they get from Statcast easy for every fan to understand and appreciate. You won't need to bring a scientific calculator to games.
As an example, Statcast introduced a metric called "Barrels" last year. Barrels is the name given to a specific type of hit. If you've ever played baseball, you know what it feels like to hit a ball in the sweet spot on the barrel of the bat. It's one of the most wonderful feelings in the world. You hit it just right and the ball soars. It almost feels effortless. Even if you haven't played the game, you know when a hitter really connects by the sound and the way the ball jumps off the bat. Barrels is a statistic that measures something we've seen on the field.
In Statcast speak, Barrels represents balls that are hit just right. The two variables used are exit velocity, which is how hard the ball is hit (speed off the bat), and launch angle (the degree of loft off the bat). Hitters want to hit the ball as hard as they can and at just the right angle. Statistically, the sweet spot is an exit velocity of 98 mph or greater and a launch angle between 26 and 30 degrees. When a hitter squares up the ball that meets both criteria, good things will happen (like home runs).
Why is this important? Why do we need a metric that tells us how well the hitter hit the ball when we can just see where the ball lands? Well, think about a game played on a very windy day, like when the wind is blowing in at Wrigley Field. A hitter could hit the ball just right but have it die in the wind and get caught on the warning track. If that happens multiple times during the season, the hitter's statistics will suffer, but the reality is that he has hit the ball well and the random variation of the weather has made him look worse than he is.
If you're a dedicated baseball fan who watches most of the games of your favorite team, you may remember seasons in which a hitter just seemed to have bad luck repeatedly. He hit line drives that were caught by infielders or deep fly balls that were chased down at the fence by outfielders. You know he's better than his statistics because you've seen him play regularly. Another guy might always seem to get the dinky little hit to drop in. When his luck dries up, his nice batting average will drop with it.
Statcast can put a number on these hits. Statcast could say that a particular hitter had, for example, 25 Barrels during the season, but just 20 home runs. Statcast would verify in numbers what your eyes have been telling you all season long.
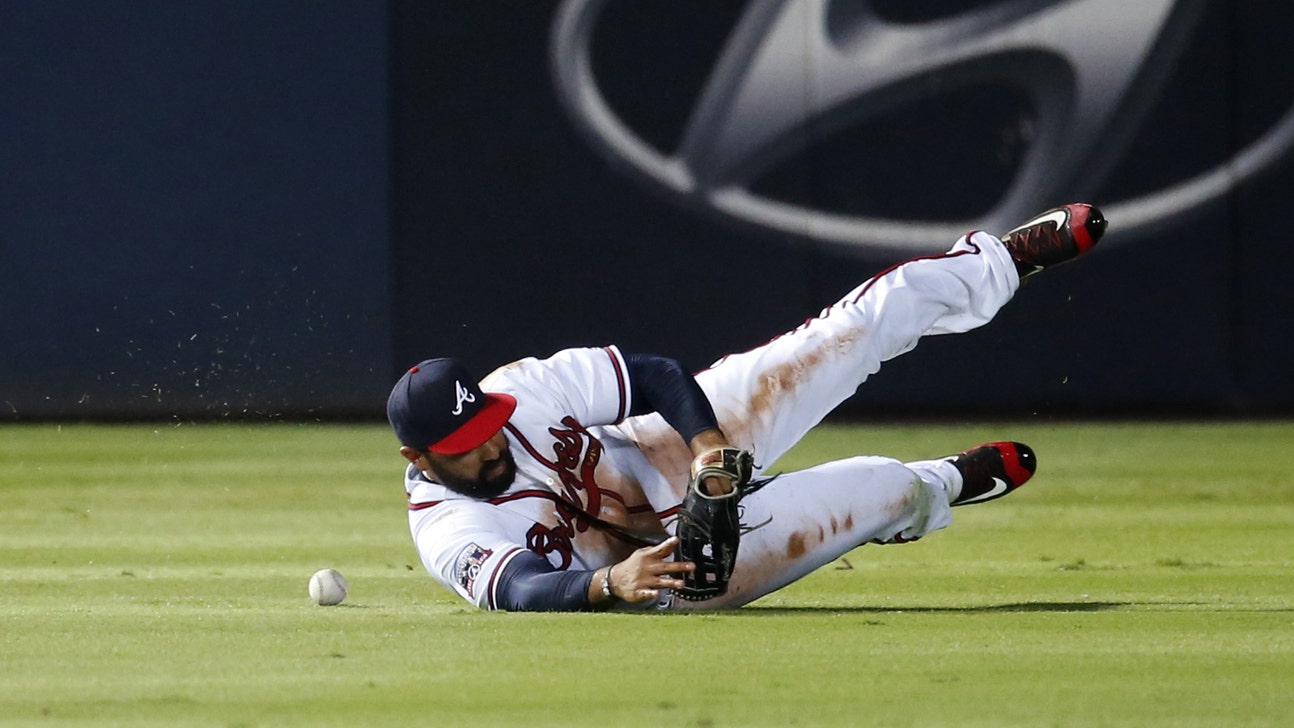
Another area in which Statcast is making big strides is evaluating how a player performs on defense. Measuring defense has been the most difficult thing for advanced statistics to do. In their recent presentation at the Sloan Conference, Williams and Petriello showed plays made by two different outfielders.
More from Call to the Pen
Cincinnati Reds outfielder Billy Hamilton, who is one of the fastest runners in baseball, was shown making a tremendous diving catch. The Statcast data showed that Hamilton ran 71 feet in 3.7 seconds to make that play. Using data from the past, the numbers showed that outfielders make the catch Hamilton made just seven percent of the time. It was a truly exceptional catch.
In contrast, they also showed a play made by Matt Kemp in which Kemp ends up diving for a ball and making the catch. The Statcast data showed that the ball Kemp caught should have been a routine fly out. It's a ball that is caught 75 percent of the time. Kemp made it look difficult because he's not fleet of foot and he took a bad route to the ball.
Statcast can use the distance the ball is from the outfielder's starting point and how long the ball is in the air to create a catch percentage. If you're watching on TV, you may see a ball drop in front of the lumbering outfielder in left field and think, "Man, he should have caught that!" Then the Statcast catch percentage shows that the ball is caught 80 percent of the time and confirms what you just saw on the field.
One of the main goals of the men working with Statcast is to make the information they come up with easy to understand for everyone. Statcast should enhance a broadcast, not intrude upon it. That being said, as I mentioned above, baseball fans come in all shapes and sizes and have different things about the game that they enjoy. When it comes to Statcast, some people will love it, others will hate it, and others won't even notice it, but we'll all still be doing something we love, watching baseball.