Baseball's most productive low-authority hitters of all-time

By Tony Blengino
A couple weeks ago, we took a look at the most and least authoritative hitters of all time, utilizing raw contact scores, or production relative to the league on all plate appearances not resulting in a strikeout or walk. One of the reader comments suggested to take a look at the most productive low-authority hitters, and the least productive high-authority hitters. Today, we’ll look at the former, and later this week, the latter.
First of all, a review of the methodology, and some parameters. We calculate raw contact scores by stripping away the strikeouts (Ks) and walks (BBs), and applying run values to all balls in play based on the norms for that era. The results are then scaled to 100. Raw contact scores were calculated for all regulars going back to 1901. Since we don’t have access to granular batted-ball data going that far backward, we’re not going to be able to adjust for context. That context includes the effects of ballparks, individual player’s speed, and of course, luck. In a given year, that those factors might affect an individual player significantly. Over the long haul, however, raw ball-striking ability, or lack thereof, as well as contact quality, the respective frequency of line drives and popups, of weak and hard contact in general, makes the difference.
I have done extensive work on pitchers’ contact-management ability in the past, utilizing a nearly identical method. In a given season, an elite contact-managing pitcher will have a contact score of 70 or better, and the best contact managers of all time post career marks in the low 80s, with 100 representing league average. Over time, a truly poor contact-managing starting pitcher might post a career contact score around 110. As you might expect, hitters have a wider range of contact scores.
A league-leading contact score for a hitter might be in the 200 range, or even higher. In fact, 102 individual season contact scores of 226 or higher have been posted since 1901. On the downside, 100 individual season contact scores of 50 or lower have been posted over that span, and the league-trailing mark is generally in that vicinity.
A couple weeks back, we identified the least authoritative hitters of all time, based on lowest average raw contact score for players with 10 or more seasons as a regular. That 10-year minimum criteria should not be taken lightly. A player who makes such light contact over an extended period of time and doesn’t lose his everyday job must be doing something right. Today, we will focus on the least authoritative hitters, based on career raw contact score, who posted the highest career OPS+ marks during their qualifying seasons. These are guys who couldn’t rely on ball-in-play (BIP) authority to be productive, but found a way to get it done, over an extended period of time.
For a bit more background on the relationship between contact score and OPS+, you might want to check out my article from last week on “The Contact Score Multiplier”. It groups players by relative K and BB rates, assigning each group a multiplier accordingly.
All of the 10 least authoritative hitters of all time were shortstops; the positional composition of this group is much more diverse: half are second basemen, while two catchers, a center fielder and a first and third baseman round it out.
10 – Tim McCarver (Career Contact Score = 94.9, OPS+ = 102.0, 10 qualifying seasons) – Before he was an announcer, he was a pretty darned good left-handed-hitting catcher, playing in four different decades. Offensively, his calling card was an extremely low K rate: in all 10 of his qualifying seasons, he had a K rate over a standard deviation below league average. In three of those seasons, it was over two full standard deviations below. His peak contact score (136) and OPS+ mark (116) both occurred in 1967, one of the more pitcher-friendly seasons of all time.
9 – Max Bishop (Career Contact Score = 93.6, OPS+ = 103.2, 11 qualifying seasons) – The first of five second baseman, and by far the least recent player on the list. Played during one of the most offense-oriented eras of all time, the second half of the ’20s and first half of the ’30s. While McCarver relied on not striking out, Bishop relied on the base on balls: in all of his last 10 seasons as a regular, Bishop’s BB rate was over two standard deviations above league average. Like McCarver, Bishop was a key player on a pair of World Champion clubs.
8 – Chuck Knoblauch (Career Contact Score = 93.4, OPS+ = 105.9, 12 qualifying seasons) – For the first half of his career, it certainly didn’t appear that Knoblauch would wind up with a career contact score below 100. He posted raw contact scores of 146 and 130 in his age 26 and 27 seasons, raising his career mark to 105.5. His entire offensive game, from BIP authority to foot speed, unraveled after his move to the Bronx. Third straight member of this list to play on multiple World Series champs, one in Minnesota and three in New York.
7 – Ken Oberkfell (Career Contact Score = 92.1, OPS+ = 101.0, 10 qualifying seasons) – Dubbed “5020” in one of the early Bill James Abstracts for his propensity to accumulate base hits while scoring and driving in runs relatively infrequently. A low strikeout rate was his best trait: Oberkfell’s K rate was over a full standard deviation below league average in all 10 of his qualifying seasons, and over two standard deviations below in two of them. He never posted a seasonal contact score over 106, doing so in both of his first two seasons, and then descending gradually from there. One WS ring for Oberkfell.
6 – Pete O’Brien (Career Contact Score = 91.6, OPS+ = 104.4, 10 qualifying seasons) – O’Brien posted the lowest career raw contact score for any first baseman with at least 10 seasons as a regular. Here’s the entirety of that all-time low-authority team: 1B- O’Brien, 2B- Ted Sizemore (73.5), SS- Tim Foli (65.7), 3B- Ossie Bluege (84.9), LF- Howie Shanks (86.4), CF- Juan Pierre (74.3), RF- Joe Orsulak (88.8), C- Brad Ausmus (75.1). The fourteen-lowest career contact scores all belong to shortstops. At least O’Brien makes this list, though he remains below average offensively for his position. O’Brien’s K rate was over a standard deviation better than league average five times, his BB rate, two times. Unlike the previously discussed players, O’Brien never played in a postseason game.
5 – Mark Kotsay (Career Contact Score = 91.5, OPS+ = 100.8, 11 qualifying seasons) – The only outfielder on our list, Kotsay played more games in center than in any other position. He’s yet another player on this list who rode a below average K rate to offset BIP authority shortcomings: his K rate was over a standard deviation below league average in eight of his 11 seasons as a regular. Never posted a seasonal contact score above 116 or OPS+ mark above 122.
4 – Mark Loretta (Career Contact Score = 88.4, OPS+ = 101.1, 11 qualifying seasons) – Now for the first of only four qualifying players with career contact scores below 90. Very similar to Oberkfell in most respects, Loretta is yet another member of this group whose key attribute is his low strikeout rate. Loretta’s K rate was over a standard deviation below league average in each of his last 10 seasons as a regular. His peak seasonal contact score was only 111, and it was 84 or lower in seven of his 11 qualifying seasons.
3 – Yadier Molina (Career Contact Score = 88.2, OPS+ = 100.1, 10 qualifying seasons) – It’s been a tale of two careers offensively for the youngest Molina brother. The Ozzie Smith of catchers, he had a career contact score of 71.2 after six qualifying seasons; if he would have maintained that level for four more seasons, he’d have been the least authoritative catcher ever and made the overall top-10 least-authoritative list. Instead, he put up raw contact scores of 109, 119 and 123 in 2011-13. His K rate has been over a standard deviation below league average in all 10 of his qualifying seasons, and was over two below three times. He also has two WS rings to his name.
2 – Ron Hunt (Career Contact Score = 84.4, OPS+ = 104.9, 11 qualifying seasons) – As you’ll soon see in the table below, most of the players on this list recorded above average OPS+ marks slightly more often than they did raw contact scores. The last two guys on this list up the ante. Hunt’s seasonal OPS+ exceeded 100 eight times, while his contact score did only twice. Hunt’s secret weapon? The hit by pitch. He lasted “only” 11 seasons as a regular, but stands sixth on the all-time HBP list, leading the league in that department six straight times, and setting a single-season record of 50 in a season. On top of that, Hunt’s K rate was over a standard deviation below league average all 11 seasons, and over two below twice.
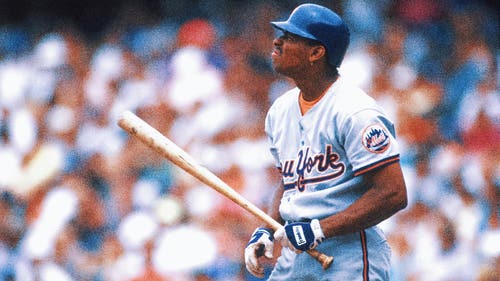
1 – Willie Randolph (Career Contact Score = 84.0, OPS+ = 105.8, 16 qualifying seasons) – When I saw the reader comment suggesting this topic, my gut instinct told me that Randolph was the #1 guy, and in this instance, my gut was right. When you look at it, it’s not even close. Not only does he have the lowest career contact score of any player with a career OPS+ over 100, he also, by far, had the most qualifying seasons, with 16, and fractionally finished behind only Chuck Knoblauch in career OPS+ among this group. He had 13 years with an OPS+ over 100, but only two years with an above-average contact score. His K rate was over a full standard deviation below league average 15 times, and his BB rate was over a full standard deviation above league average 11 times (over two standard deviations above twice). He never posted a seasonal contact score above 104, but only three times had a seasonal OPS+ mark below 100, at a low-offense position. Though he won only one World Series, he played in four of them. This, my friends, is what an under-the-radar, winning ballplayer looks like.
Some low authority performers who missed the 10 seasons as a regular cutoff? How about Casey Kotchman (83.3 career contact score, 100.2 career OPS+, 6 qualifying seasons), Paul Lo Duca (84.2, 100.6, 7), Scott Hatteberg (86.7, 102.0, 9), Yunel Escobar (87.1, 100.8, 7), Matt Lawton (89.1, 107.6, 9), Denard Span (90.4, 104.5, 7), Doug Mientkiewicz (90.5, 100.9, 6), Wayne Gross (90.6, 105.0, 8), and Eddie Stanky (91.1, 108.0, 8). A couple more active players, Carlos Ruiz andMelky Cabrera, are right behind them. And how about outlier among outliers,Nori Aoki, who stands at a 82.7 career contact score, with a 102.3 career OPS+, in three qualifying seasons. The 2015 league leaders to date? In the NL it’s David Murphy (87 contact score, 110 OPS+), in the AL, believe it or not, it’s David Ortiz(86, 105), thanks to solid K and BB rates and the destructive impact of infield overshifts on his contact score.
What does all of this tell us? There are loud and soft ways to be productive offensively. These guys are the understated ones, the technicians, who have mastered the nuances of the game to become successful in what is often a noisy, big man’s game. Interestingly, there aren’t many ancient names on this list. There is a place for such players in today’s game, and quite often, that place is on a winning ballclub that knows where to find value. The out is the single most important statistic in the game, and these players, despite raw tools that sometimes didn’t match up, certainly knew how to avoid giving them away.
Below, for reference purposes, is some summary information about our top-10 low-authority producers. The right-most column indicates their career Contact Score/OPS+ multiplier:
| Yrs. | CAR CSC | YR > 100 | CAR OPS+ | YR > 100 | CAR MULT | |
|---|---|---|---|---|---|---|
| Randolph | 16 | 84.0 | 2 | 105.8 | 13 | 125.95 |
| R.Hunt | 11 | 84.4 | 2 | 104.9 | 8 | 124.29 |
| Y.Molina | 10 | 88.2 | 3 | 100.1 | 5 | 113.49 |
| Loretta | 11 | 88.4 | 4 | 101.1 | 4 | 114.37 |
| Kotsay | 11 | 91.5 | 3 | 100.8 | 4 | 110.16 |
| P.O’Brien | 10 | 91.6 | 4 | 104.4 | 6 | 113.97 |
| Oberkfell | 10 | 92.1 | 3 | 101.0 | 6 | 109.66 |
| Knoblauch | 12 | 93.4 | 3 | 105.9 | 6 | 113.38 |
| M.Bishop | 11 | 93.6 | 3 | 103.2 | 4 | 110.26 |
| McCarver | 10 | 94.9 | 3 | 102.0 | 4 | 107.48 |
More from Fangraphs:


