Fantasy Football Study: should you trust defensive fantasy points allowed per game?
Each week during the recently concluded fantasy football season, I wrote what's known in the fantasy industry as a DvP or fantasy points allowed article - basically, targeting borderline players for start/sit based on how well the opposing defense has fared against their position. As the season went along, I got the feeling that this exercise wasn't helping as much as I hoped, instead pointing out often-obvious suggestions for more diligent fantasy owners.
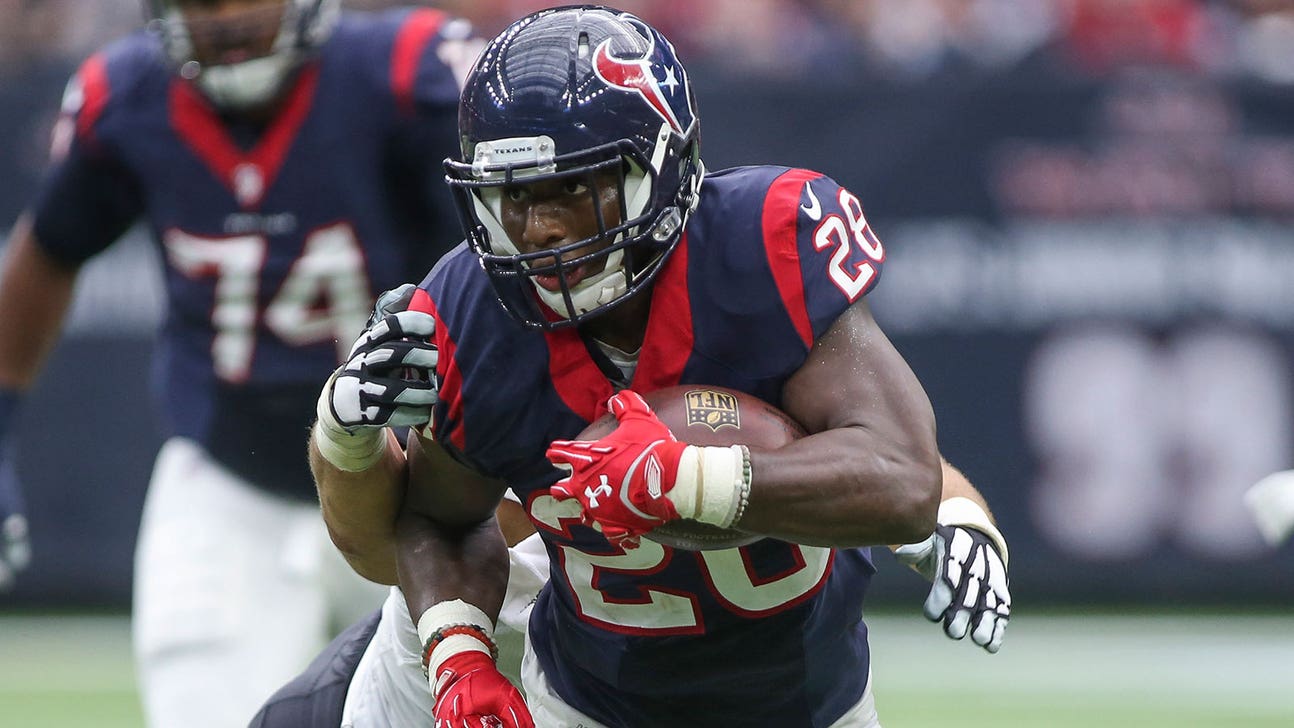
Example: Texans RB Alfred Blue gained more than 100 yards on the ground in two of his last three regular-season games, but had a Wildcard Weekend matchup with the Chiefs, who rank fourth in fantasy points allowed per game to opposing RBs (14.4 FPAPG). Because of that data, you might have leaned against starting him (Blue ran 17 times for 99 yards in the game).
How did this metric fare - for better or for worse - in 2015? To find out, we examined the top quarterbacks, running backs and wide receivers, and used their fantasy points-per-game (FPPG) averages:
Below is a summary of how the players performed. Please note that we subjectively removed certain players whose small sample sizes may have skewed the results.
Player pool: Top 30 by average points per game (minus Geno Smith)
Average FPPG versus top 10 defenses: 15.3
Average FPPG versus bottom 10 defenses: 20.8
Overall FPPG: 17.6
For all positions, we'd obviously expect players to perform better than average against the worst pass defenses, and below-average versus the better pass defenses. The numbers worked out that way for 24 of our 30 quarterbacks, with Matthew Stafford and Kirk Cousins being the most extreme examples. Here's how those two passers played:
Five quarterbacks - Stafford, Cousins, Josh McCown, Joe Flacco and Marcus Mariota - had double-digit point differentials between the good/bad opponents. All can be described as typical streaming candidates rather than normally obvious starts or sits.
Let’s use QBs 11-20 to gauge the advantage for the usual flex candidates. They averaged a six-point spread (20.9-14.9) in their play against the good and bad defenses, which is slightly higher than the 5.5-point spread for the overall QB group. Interesting, but not too exciting.
Interesting note: Cam Newton averaged more FPPG versus the top 10 defenses than any other QB averaged overall. M-V-P, M-V-P ...
Player pool: Top 60 by average points per game (minus Steven Jackson, Mike Gillislee, Lance Dunbar, Khiry Robinson, DuJuan Harris, Dexter McCluster, Ahmad Bradshaw, Donald Brown, Cameron Artis-Payne, Travaris Cadet, Arian Foster)
Average FPPG versus top 10 defenses: 7.8
| Player | vs. Top 10 | vs. Bottom 10 | Overall |
| Stafford | 10.7 | 28.9 | 18.1 |
| Cousins | 7.8 | 23.5 | 18.1 |
Average FPPG versus bottom 10 defenses: 10.9
Overall FPPG: 9.1
Again, the overall average worked out as expected based on strength of opponent, and 46 of the 60 running backs met the likely result. Adrian Peterson struggled mightily against three top-10 RB defenses (57 carries, 147 yards), while Danny Woodhead, DeMarco Murray and Isaiah Crowell took advantage when facing bad units.
As with the quarterbacks, the flex types - we used RBs 25-36 - had a larger spread in performance versus good/bad defenses (10.5-6.9) than the overall group did (10.9-7.8). But just like with the quarterbacks, the difference probably isn’t of enough note to make us consider it for much strategic assistance.
Player pool: Top 60 by average points per game (minus Leonard Hankerson, Percy Harvin)
Average FPPG versus top 10 defenses: 7.6
Average FPPG versus bottom 10 defenses: 11.2
Overall FPPG: 9.3
One more time, the aggregate numbers worked out as expected. Doug Baldwin's numbers against bad WR defenses look great - he faced all three of his (Steelers, Ravens, Browns) in Weeks 12 through 14, and posted a combined 17-321-8 line in those games. No. 15 wideout Martavis Bryant had the second-highest average versus top-10 WR defenses, thanks to a 6-137-2 outburst against the Cardinals in Week 6.
As with the other positions, the flexville wideouts (WR25-36) had a larger spread in their performances versus the good/bad defenses than the the overall group did. The flexes posted 12.6 points against the bad units and 8.2 against the good ones, while the larger group’s differential was 11.2-7.6. The difference isn’t large, and might just indicate that mediocre players have less stable performance levels than their elite counterparts.
We could certainly dig a lot deeper into numbers - for example, examining the performances of a defense’s individual cornerbacks versus wide receivers is more instructive than the play of the unit as a whole. But can DvP numbers alone be helpful? Sure, as long as we remember that (like with everything else) they don’t provide a guaranteed path to fantasy glory.
The numbers show advantages, but they’re not glaring, they’re often obvious, and in many cases they’re based on samples of a few games. Also, as suggested by Newton’s case, they usually shouldn’t cause you to bench a star for a scrub because he’s playing against the Saints or Giants.
Consider DvP to be a surface-level tiebreaker - not bad, but you can do better if you'd like to spend more time and effort creating your best starting lineup. How badly do you want to win, Fantasy Owner?

2025 NFL Week 16 Buzz: Patrick Mahomes Begins Rehab; Andy Reid Not Retiring?

NFL Injury Report Week 16: Rashee Rice Out; Drake London, Marvin Harrison Jr. Return

2025 NFL Playoff Picture, Bracket, Schedule After Week 15

Super Bowl 2026 Odds: Rams, Seahawks Remain Atop Board; Broncos, Bills Rise

NFL Coaching Hot Seat Rankings: Pete Carroll's Seat Feels Hotter Than Ever

QB Stock Market Week 16: Josh Allen Intercepted Drake Maye's MVP Candidacy

Who Are the 10 Best Quarterbacks to Have Never Won a Super Bowl?
2025 NFL Playoff Picture, Bracket, Schedule Updated After Week 14

Who are the 10 best wide receivers of all-time?


-
2025 NFL Week 16 Buzz: Patrick Mahomes Begins Rehab; Andy Reid Not Retiring?
NFL Injury Report Week 16: Rashee Rice Out; Drake London, Marvin Harrison Jr. Return
2025 NFL Playoff Picture, Bracket, Schedule After Week 15
-
Super Bowl 2026 Odds: Rams, Seahawks Remain Atop Board; Broncos, Bills Rise
NFL Coaching Hot Seat Rankings: Pete Carroll's Seat Feels Hotter Than Ever
QB Stock Market Week 16: Josh Allen Intercepted Drake Maye's MVP Candidacy
-
Who Are the 10 Best Quarterbacks to Have Never Won a Super Bowl?
2025 NFL Playoff Picture, Bracket, Schedule Updated After Week 14
Who are the 10 best wide receivers of all-time?