There are all sorts of prescriptions for a good changeup. We talk about things like "€œvelocity gap" and "€œtilt"€ and "€œfade"€ when we discuss how good a changeup will be. But what about the curveball? Can we spot a good one coming?
We can use our Arsenal Score work to identify good curveballs in general, just as we used it to find bad changeups a couple weeks ago. Basically, by weighting grounders and whiffs on a pitch, we can assign it a score based on those easy-to-identify and important outcomes.
According to this metric, here are the 10 best curves thrown at least 100 times last season:
| Pitcher | GB% | swSTR% | Arsenal Score |
|---|---|---|---|
| Brett Cecil | 56% | 29% | 5.34 |
| Mark Melancon | 55% | 25% | 4.19 |
| Nick Masset | 90% | 15% | 4.15 |
| Craig Kimbrel | 62% | 23% | 4.04 |
| Blaine Hardy | 91% | 14% | 3.75 |
| Vic Black | 78% | 17% | 3.72 |
| David Robertson | 60% | 22% | 3.69 |
| Carlos Martinez | 53% | 24% | 3.50 |
| Cody Allen | 53% | 20% | 2.35 |
| Kevin Jepsen | 70% | 14% | 2.30 |
And here are the 15 best curves thrown by starters last season (minimum 200 thrown):
| Pitcher | GB% | swSTR% | Arsenal Score |
|---|---|---|---|
| Yusmeiro Petit | 27% | 29% | 2.82 |
| Trevor Cahill | 61% | 19% | 2.75 |
| Corey Kluber | 45% | 22% | 2.41 |
| Jose Fernandez | 43% | 22% | 2.17 |
| Trevor Bauer | 53% | 19% | 2.07 |
| Alex Wood | 64% | 15% | 2.06 |
| A.J. Burnett | 57% | 17% | 2.03 |
| Jake Arrieta | 53% | 18% | 1.88 |
| Alex Cobb | 67% | 14% | 1.78 |
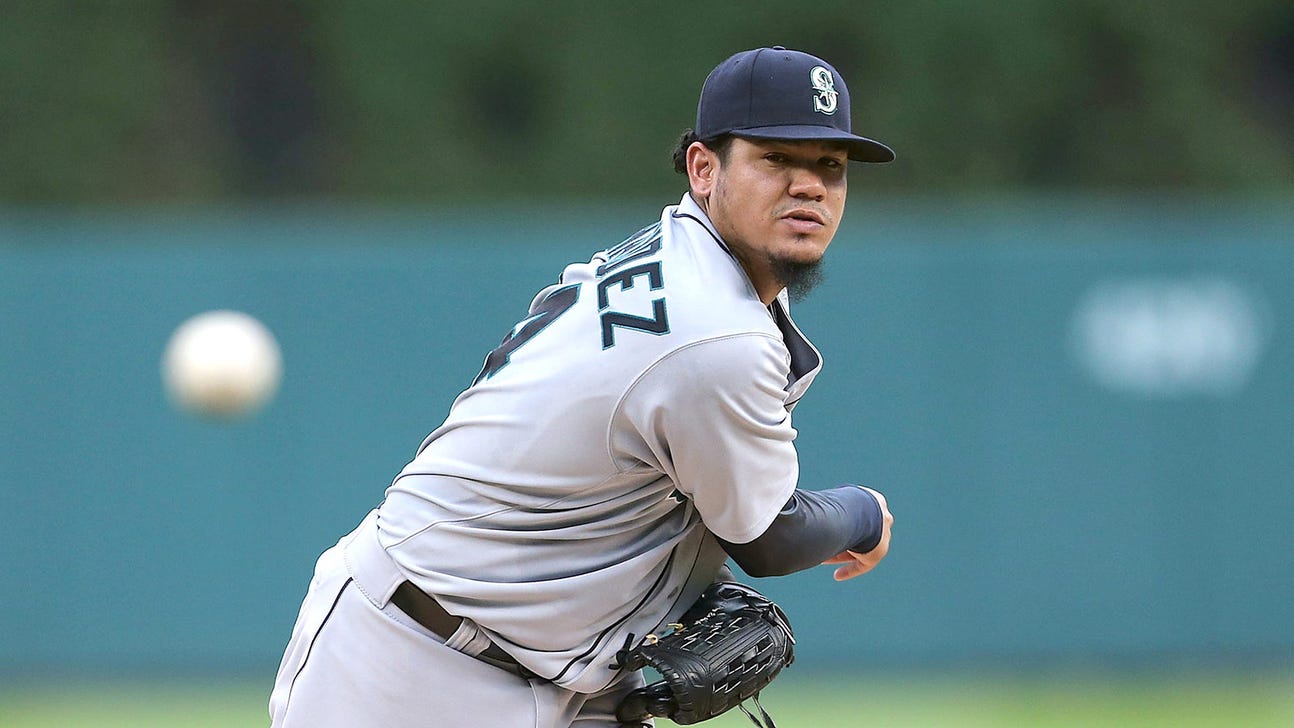
| Felix Hernandez | 66% | 14% | 1.75 |
| Collin McHugh | 57% | 16% | 1.69 |
| Jacob deGrom | 57% | 16% | 1.67 |
| Gerrit Cole | 61% | 15% | 1.66 |
| Zack Wheeler | 63% | 14% | 1.62 |
| Tyler Skaggs | 68% | 13% | 1.61 |
Those are a lot of great yakkers. But you'll immediately see that there are a few different ways to have a great curve. Some are big old honking hammers, like the one Garrett Richards uses that has a 12-inch drop. Some you might call power curves, like the ones Cody Allen (86 mph) and Craig Kimbrel (85.3) twirl up there. Some are sidewinders, like the ones thrown by Corey Kluber and Charlie Morton, which both have double-digit horizontal movement.
In the face of so many approaches, is there anything descriptive we can say about a curveball? In other words, should we tell our prospects to throw big old slow curveballs with drop, or power curves with sizzle?
It turns out, that, yes, we can tell them ... to do either.
If you take the most important aspects of a curveball and test their correlations against outcomes, you can come up with a roadmap to a good curveball, much as Harry Pavlidis did with the changeup before. Let's use grounders and whiffs again, because they are the easiest to measure.
There aren't a lot of strong correlations in this bin, but you might see two numbers that stick out. Here are the correlation coefficients (r) for the different curveball stats tested against curve whiff and grounder rates. (n=284)
Don't worry about the table too much. The relationships aren't super strong, and what you really want to do here is look at relative strengths. Here are the closest things to definitive statements that we can say from those outcomes.
* If you want whiffs from your curve, throw it hard.
* If you want grounders from your curve, make it drop.
It's really that simple. Think of the hard curves from Allen, Kimbrel and Carlos Martinez. As a group, they got more than twice the amount of whiffs from their curves as the average curve got (11 percent). Wade Davis, Kevin Jepsen, Dellin Betances and Bryan Morris also have hard curves. Marcus Stroman, Gerrit Cole and Yordano Ventura do the same as starters and get whiffs for their trouble.
Mike Fiers had the second-most drop among pitchers who threw at least 150 curves last year, and he had a 71 percent groundball rate on the pitch. Chris Tillman, also the owner of a big yellow hammer, had a 55 percent groundball rate. Blaine Hardy had a 10-inch drop and a 91 percent grounder rate.
If you test curveball velocity against drop, you find that the two are negatively related. So you might have to choose one or the other. Only two curves that averaged over 80 mph last year got very close to 10 inches of drop: Alex Cobb (80.7 mph, 9.7 inches of drop) and Felix Hernandez (80.2, -9.9). Only four curves over 83 mph got six inches of drop: Kimbrel (85.3, -6.2), Jepsen (83.8, -6.3), Nate Karns (83.1, -6.3) and David Robertson (83, -6.6). Heady company with a few interesting names sprinkled in.
The outliers on the other side are less exciting. Eric Stults had the slowest curve in our sample (67.7 mph) and also only five inches of drop. His Arsenal Score for the pitch was among the worst 10 (minimum 200 thrown).
| Whiff% | GB% | |
|---|---|---|
| Curve Velocity | 0.381 | 0.158 |
| Fastball Velocity | 0.190 | 0.137 |
| Velocity Diff | -0.307 | 0.078 |
| X-Mov | 0.118 | 0.040 |
| Y-Mov | 0.151 | -0.386 |
| Pitcher | GB% | Whiff% | Arsenal Score |
|---|---|---|---|
| Hector Santiago | 32% | 4% | -3.79 |
| Joel Peralta | 33% | 4% | -3.71 |
| Shelby Miller | 31% | 5% | -3.62 |
| J.J. Hoover | 32% | 5% | -3.57 |
| John Danks | 32% | 6% | -3.26 |
| Jason Vargas | 41% | 3% | -3.20 |
| Max Scherzer | 26% | 8% | -3.20 |
| Kyle Lohse | 40% | 5% | -2.83 |
| Eric Stults | 38% | 6% | -2.69 |
| Jeremy Guthrie | 44% | 4% | -2.67 |
Since velocity is so important for whiffs, let's notice that Shelby Miller, who shows up on this bottom 10 list, also lost more velocity on his curveball than anyone not named Brian Wilson, Tanner Roark, Sean Marshall, Jhoulys Chacin, Danny Farquhar or Jenrry Mejia. And many of the guys who lost more velocity were hurt. A couple ticks on the gun for Miller'€™s curve might not have seemed like a big deal, but velocity is important to the curve. If he can't get that velocity back, maybe he'd be best suited trying to find a way to bury it -- Kluber and Ian Kennedy both added more than two inches of drop to their curves last season, to great benefit.
A few interesting case studies arise if you look at pitchers who have good shape and velocity to their curves but haven't had great results.
Mike Bolsinger got fewer whiffs than average on his curve (10.6 percent), but only eight players had a smaller velocity difference between their fastball and curve. And his 79.3 mph curve was two miles faster than the sample average.
Karns has top-15 curveball velocity (83.1) and good drop, but his whiff rate (13.6 percent) was second-worst among the 15 fastest curves. He's an interesting arm to watch in Tampa.
Brandon Maurer had the biggest curveball drop in our sample (-12.8) and showed up elsewhere as having the most spin on his curve. He did get 67 percent grounders on his curve, but his old team (Seattle) made him drop the pitch. Maybe the Padres will let him throw it.
There was a decent, if not robust, relationship between horizontal movement and strikeouts. If you look at the top 20 by horizontal movement, they had a 14 percent whiff rate, compared to the league's 11 percent average. The outlier there is Clay Buchholz, with a top-five sweeping curve and the worst whiff rate in the group (8.4 percent).
And finally, down in the Marlins bullpen, there's an interesting name without a great big sample to his game: Sam Dyson. He added more velocity to his curveball last season than all but two pitchers in baseball. That gives him top-15 curve velocity, and with an 11 percent whiff rate, the worst whiff rate in the top 25 when sorted by mph. With Bryan Morris, Steve Cishek and A.J. Ramos at the back of that €'pen, the Marlins might be well set for a surprising run this season.
We might not have busted any brains today. There's long been a choice for curves -- hard and tight or slow and big -- but it is interesting to see what those decisions mean for a young pitcher. The big old Uncle Charlies are pretty to watch, but the sizzling power curves get the whiffs.
Last Night In Baseball: The Red Sox Are Inexplicably Approaching A Wild-Card Spot

Cardinals Standout Rookie JJ Wetherholt Agrees To 8-Year Extension Worth Over $100M

2026 MLB All-Star Game: Ranking All 70 Players Chosen For The Midsummer Classic
2026 MLB Home Run Derby Participants: Here's Who Has Committed

Red Sox Arrive 2 Hours Before Scheduled Game vs. Mets After Team Plane Problems

MLB 2026 Buzz: More Details Emerge On JJ Wetherholt Extension With Cardinals
How to Watch the 2026 MLB All-Star Week: Schedule, Times, TV, Streaming

2026 MLB All-Star Rosters Revealed: See Who Joins Shohei Ohtani And Aaron Judge

2026 MLB All-Star Team Picks: Full 32-Player Rosters For American & National Leagues

-
Last Night In Baseball: The Red Sox Are Inexplicably Approaching A Wild-Card Spot
Cardinals Standout Rookie JJ Wetherholt Agrees To 8-Year Extension Worth Over $100M
2026 MLB All-Star Game: Ranking All 70 Players Chosen For The Midsummer Classic
-
2026 MLB Home Run Derby Participants: Here's Who Has Committed
Red Sox Arrive 2 Hours Before Scheduled Game vs. Mets After Team Plane Problems
MLB 2026 Buzz: More Details Emerge On JJ Wetherholt Extension With Cardinals
-
How to Watch the 2026 MLB All-Star Week: Schedule, Times, TV, Streaming
2026 MLB All-Star Rosters Revealed: See Who Joins Shohei Ohtani And Aaron Judge
2026 MLB All-Star Team Picks: Full 32-Player Rosters For American & National Leagues