
WhatIfSports Super Bowl power rankings: comparing the Patriots to past champions
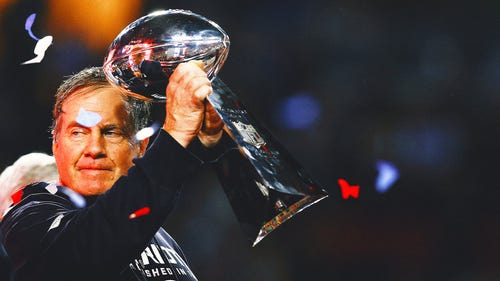
Once again, Bill Belichick and Tom Brady are NFL champions. The duo delivered a Super Bowl title to the New England Patriots for the fifth time during their tenure. Before enjoying a well-deserved offseason, we have a couple more challenges for Belichick, Brady and company…
How do the 2016 Patriots compare to the franchise’s Super Bowl champions of 2001, 2003, 2004 and 2014? Using WhatIfSports.com’s NFL simulation engine, we played a round robin tournament with every New England championship-winner. Every team in the tourney played every other team 101 times. Check out how the squads fared:
| Ranking Every New England Super Bowl Champ | |||||
|---|---|---|---|---|---|
| Rnk | Team | Win % | Avg PF | Avg PA | Simulate |
| 1 | 2014 New England Patriots | 63.0 | 27.7 | 22.9 | Sim > |
| 2 | 2004 New England Patriots | 62.4 | 26.2 | 22.1 | Sim > |
| 3 | 2003 New England Patriots | 54.4 | 23.0 | 21.0 | Sim > |
| 4 | 2016 New England Patriots | 49.6 | 24.5 | 24.6 | Champs! |
| 5 | 2001 New England Patriots | 20.6 | 17.9 | 28.7 | Sim > |
New England’s latest edition won nearly 50 percent of its games, which ranked fourth in the five-team field. The 2014 team narrowly edged the Patriots’ 2004 winner for the best winning percentage in the tournament, coming out on top in 63.0 percent of contests. Unsurprisingly, the 2014 Patriots were also the highest-scoring team in the simulation, averaging 27.7 points. The title of best defense went to the 2003 team, which held opponents to 21.0 points per game.
The Patriots’ dynasty began with the 2001 team, but the other squads showed no respect for their elders in the tournament. The 2001 Patriots won just 20.6 percent of their games, with a -10.8 scoring margin.
Next, we used the same format to see how the 2016 Patriots stack up against every other Super Bowl champion in NFL history. Every team in the field played every other team 101 times. Here’s how they finished:
| Ranking Every Super Bowl Champion | |||||
|---|---|---|---|---|---|
| Rnk | Team | Win % | Avg PF | Avg PA | Simulate |
| 1 | 1999 St. Louis Rams | 77.6 | 30.7 | 20.4 | Sim > |
| 2 | 1989 San Francisco 49ers | 69.8 | 28.3 | 21.7 | Sim > |
| 3 | 2013 Seattle Seahawks | 67.3 | 25.7 | 19.6 | Sim > |
| 4 | 1991 Washington Redskins | 63.9 | 26.5 | 21.6 | Sim > |
| 5 | 1985 Chicago Bears | 63.7 | 24.4 | 19.6 | Sim > |
| 6 | 1996 Green Bay Packers | 61.6 | 24.7 | 20.9 | Sim > |
| 7 | 1984 San Francisco 49ers | 61.5 | 27.6 | 23.3 | Sim > |
| 8 | 1971 Dallas Cowboys | 61.1 | 25.0 | 21.0 | Sim > |
| 9 | 2009 New Orleans Saints | 60.7 | 28.8 | 25.2 | Sim > |
| 10 | 1994 San Francisco 49ers | 59.5 | 25.6 | 22.6 | Sim > |
| 11 | 1993 Dallas Cowboys | 58.7 | 26.9 | 23.8 | Sim > |
| 12 | 1998 Denver Broncos | 58.5 | 26.6 | 23.5 | Sim > |
| 13 | 2002 Tampa Bay Buccaneers | 57.7 | 21.8 | 19.5 | Sim > |
| 14 | 2005 Pittsburgh Steelers | 57.2 | 23.7 | 21.2 | Sim > |
| 15 | 1972 Miami Dolphins | 56.4 | 25.7 | 22.7 | Sim > |
| 16 | 1979 Pittsburgh Steelers | 56.0 | 24.9 | 22.6 | Sim > |
| 17 | 2014 New England Patriots | 54.9 | 26.0 | 24.9 | Sim > |
| 18 | 2010 Green Bay Packers | 54.3 | 24.9 | 23.4 | Sim > |
| 19 | 1992 Dallas Cowboys | 53.4 | 24.0 | 22.7 | Sim > |
| 20 | 1975 Pittsburgh Steelers | 52.6 | 23.6 | 22.5 | Sim > |
| 21 | 1973 Miami Dolphins | 51.7 | 22.9 | 21.6 | Sim > |
| 22 | 1977 Dallas Cowboys | 50.6 | 21.7 | 21.2 | Sim > |
| 23 | 1987 Washington Redskins | 50.5 | 25.0 | 24.9 | Sim > |
| 24 | 1976 Oakland Raiders | 50.1 | 24.7 | 24.7 | Sim > |
| 25 | 2011 New York Giants | 49.9 | 26.0 | 26.2 | Sim > |
| 26 | 2004 New England Patriots | 49.3 | 24.4 | 24.8 | Sim > |
| 27 | 1988 San Francisco 49ers | 49.3 | 23.7 | 24.0 | Sim > |
| 28 | 1997 Denver Broncos | 49.1 | 25.1 | 25.6 | Sim > |
| 29 | 1969 Kansas City Chiefs | 48.9 | 21.8 | 22.1 | Sim > |
| 30 | 2008 Pittsburgh Steelers | 48.5 | 20.2 | 20.7 | Sim > |
| 31 | 2012 Baltimore Ravens | 47.7 | 24.0 | 25.1 | Sim > |
| 32 | 1995 Dallas Cowboys | 47.4 | 24.2 | 25.1 | Sim > |
| 33 | 2003 New England Patriots | 46.7 | 20.6 | 21.6 | Sim > |
| 34 | 1978 Pittsburgh Steelers | 46.4 | 20.7 | 21.9 | Sim > |
| 35 | 2006 Indianapolis Colts | 44.0 | 26.3 | 28.6 | Sim > |
| 36 | 1968 New York Jets | 43.7 | 21.4 | 23.4 | Sim > |
| 37 | 2000 Baltimore Ravens | 43.5 | 19.8 | 22.0 | Sim > |
| 38 | 1974 Pittsburgh Steelers | 43.4 | 19.9 | 21.8 | Sim > |
| 39 | 2016 New England Patriots | 43.4 | 22.6 | 25.3 | Champs! |
| 40 | 1966 Green Bay Packers | 43.3 | 20.4 | 21.9 | Sim > |
| 41 | 1982 Washington Redskins | 43.3 | 20.9 | 23.4 | Sim > |
| 42 | 1986 New York Giants | 42.7 | 21.1 | 23.7 | Sim > |
| 43 | 1983 Los Angeles Raiders | 42.0 | 21.2 | 24.3 | Sim > |
| 44 | 2015 Denver Broncos | 42.0 | 21.3 | 24.3 | Sim > |
| 45 | 1990 New York Giants | 41.5 | 19.9 | 23.0 | Sim > |
| 46 | 2007 New York Giants | 36.2 | 20.4 | 25.7 | Sim > |
| 47 | 1981 San Francisco 49ers | 34.3 | 19.1 | 24.5 | Sim > |
| 48 | 1980 Oakland Raiders | 31.8 | 18.3 | 24.6 | Sim > |
| 49 | 1967 Green Bay Packers | 29.6 | 18.5 | 25.5 | Sim > |
| 50 | 1970 Baltimore Colts | 27.5 | 17.8 | 25.7 | Sim > |
| 51 | 2001 New England Patriots | 25.3 | 18.0 | 27.6 | Sim > |
The 2016 Patriots won 43.4 percent of their games, good enough for a 39th out of 51 teams. Just like in the Patriots-only simulation, the 2014 team was the franchise’s best. That group only finished 17th, though, with 12 franchises having a least one team ranked higher than the 2014 Patriots.
The top team in the simulation was the Greatest Show on Turf. The 1999 St. Louis Rams averaged a simulation-best 30.7 points per game and won 77.6 percent of contests, nearly eight percentage points higher than the second-place 1989 San Francisco 49ers.
New England was joined by San Francisco and the Dallas Cowboys as franchises with five participants in the tournament, while the Pittsburgh Steelers had six. The 49ers placed three teams in the top 10, and the Cowboys had four in the top 25.
More: Super Bowl runner-up power rankings
Super Bowl LI doesn't have to be your last taste of football until September. Let WhatIfSports.com provide your daily fix. Create your ultimate roster using our Dream Teams feature. Then take that roster and simulate it against ANY TEAM IN NFL HISTORY using our NFL SimMatchup tool.

2025 NFL mock draft: Travis Hunter, Shedeur Sanders to go 1-2?

The Daily Ranker: Looking at the 10 greatest NFL quarterback seasons ever

Bill Belichick's former players say he'll 'have to change' to succeed at UNC

2025 College Football odds: Belichick, UNC early win total set at 7.5

FOX Sports presents NFL at Cosm: Schedule, tickets, information

2024 NFL Week 15 action report: Bettors backing Lions, Eagles ahead of marquee games
Bill Belichick officially named the next head coach at UNC

If you think Bill Belichick can’t win at UNC, you’re missing what’s most important
2025 Super Bowl odds: Lions favored, Rams surge

-
2025 NFL mock draft: Travis Hunter, Shedeur Sanders to go 1-2?
The Daily Ranker: Looking at the 10 greatest NFL quarterback seasons ever
Bill Belichick's former players say he'll 'have to change' to succeed at UNC
-
2025 College Football odds: Belichick, UNC early win total set at 7.5
FOX Sports presents NFL at Cosm: Schedule, tickets, information
2024 NFL Week 15 action report: Bettors backing Lions, Eagles ahead of marquee games
-
Bill Belichick officially named the next head coach at UNC
If you think Bill Belichick can’t win at UNC, you’re missing what’s most important
2025 Super Bowl odds: Lions favored, Rams surge