


Baseball Hall of Fame: Five Reasons Trevor Hoffman Is NOT a Hall of Famer
Gary A. Vasquez-USA TODAY Sports
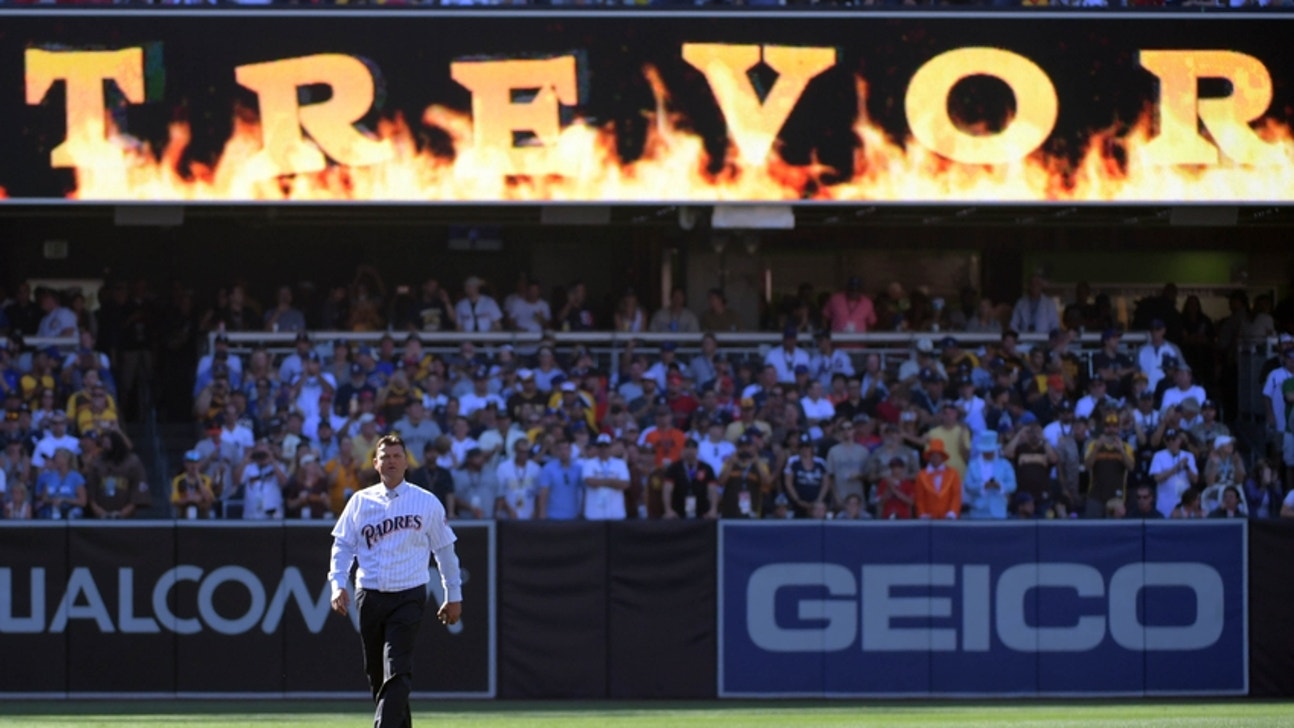
Despite being second all-time in saves, Trevor Hoffman is NOT a Hall of Fame player.
I should start by saying that I think Trevor Hoffman was a good pitcher. He had a long career with consistently better-than-league average ERAs. In 18 years in the big leagues and over 1,000 innings, Hoffman had an ERA of 2.87. That’s impressive, no doubt.
He was also consistent and reliable and fun to watch, with his ability to fearlessly throw change-up after change-up after change-up. Even when his fastball was long past the point of accurately being described as “fast,” Hoffman was able to get batters out with the deception of his change-up.
He played most of his career with the San Diego Padres, so he has iconic status in that town, along with Tony Gwynn. When he came into the game with “Hells Bells” blaring from the loudspeakers, it brought a surge of excitement for the fans. And most of the time, he got the job done. He converted around 90 percent of his save opportunities.
Despite all of the positives, I don’t believe Trevor Hoffman is a Hall of Fame pitcher. He’s the epitome of the modern day closer, the guy who is usually “saved” for the ninth inning when his team has a lead. In his career, 87 percent of the batters faced by Hoffman came in the ninth inning or later. He wasn’t a guy who was brought into a close game in the seventh or eighth inning with runners in scoring position even if that was the most important at-bat of the game. A setup guy would handle that spot, while Hoffman sat comfortably on the bench in the bullpen, waiting until the ninth inning.
Hoffman usually pitched between 60 and 70 innings per year; about one-third of the innings a starting pitcher would pitch. His 1,089 1/3 career innings doesn’t place him in the top 1,000 of MLB pitchers. Babe Ruth pitched more innings than Trevor Hoffman and also found time to hit 714 home runs (okay, that’s not really a fair comparison, but interesting nonetheless; did you know Babe Ruth pitched more innings than Trevor Hoffman?).
As good as Hoffman was, the limitations of his role as a pitcher and his failure to stand out among his peers make him unworthy of the Baseball Hall of Fame. Here are the five reasons why.
Adam Hunger-USA TODAY Sports
The Save Statistic Is Ridiculous
I admit right up front that I do not like the save as a statistic. I think the intentions were good. Sportswriter Jerome Holtzman created the statistic in 1969 because he didn’t think wins and losses were fitting statistics for relievers. He was right about that. No one should judge a reliever by his win-loss record. There are too many variables involved for a relief pitcher to be judged by wins and losses.
Holtzman created the save statistic in 1969, but it was refined over the next few years until we arrived at our current definition of a save, which has been in use since 1975. This is the rule:
A relief pitcher is awarded a save when he meets all three of the following conditions:
~ He enters the game with a lead of no more than three runs and pitches for at least one inning; or
~ He enters the game, regardless of the score, with the potential tying run either on base, at bat, or on deck; or
~ He pitches at least three innings.
For many years, the save was a statistic like any other. The game would be played, one team would win, another would lose, and the results were tallied. Somewhere along the line this changed. Managers began managing based on the statistic, rather than just let the statistic record what happened. Managers would bring in their closers based on when the save opportunity arose.
You see this often these days. Here’s an example. The home team starts the top of the ninth inning with a four-run lead. The win expectancy, based on games from 1957 to 2015, is 99.05 percent (with a three-run lead, the win expectancy would be 97.95 percent). Since it’s not a save situation yet, the closer remains in the bullpen and the manager brings in one of his middle relief guys. If that middle reliever allows a couple of base runners, even if he gets two outs along the way, suddenly you have a save situation because the tying run is on deck. It’s time for the closer.
The thing is, with that four-run lead and two outs and runners on first and second, the win expectancy is 99.42 percent. It’s actually higher than when the inning started. But because there’s now a save opportunity, in comes the closer. The manager is using his bullpen based on a statistic.
When you consider the win expectancy for teams that have a three run lead at the start of the ninth inning, it seems ridiculous that you would “save” your best pitcher for that situation just so he can earn another tally in his personal saves column. Consider this chart for win expectancy.
Win Exp.—Situation
87%–Top of 9th, home team leads by 1
94%–Top of 9th, home team leads by 2
98%–Top of 9th, home team leads by 3
82%–Bottom of 9th, away team leads by 1
92%–Bottom of 9th, away team leads by 2
97%–Bottom of 9th, away team leads by 3
With a three run lead at the beginning of the ninth inning, top or bottom, the team with the lead is going to win 97-98 percent of the time. Yet managers still go to their closer in these situations and often do so after leaving their closer on the bench when a more important moment occurred earlier in the game.
David Richard-USA TODAY Sports
More Optimal Reliever Usage Leads to More Value
There was a time when managers used their best relievers when the leverage was highest, even if that meant bringing the pitcher into the game in the seventh or eighth inning. The “firemen” of the 1970s and 1980s were often used for more than one inning and often brought in before the ninth, if needed. Because they were used when most needed, they were more valuable then the current one-inning, ninth-inning-only closers.
As an example of optimal reliever usage, we have Andrew Miller during the 2016 postseason. He was expertly used by Terry Francona. During the ALDS, he was brought into the game in the fifth inning of Game 1 and the sixth inning of Game 3. Most managers would have saved Miller for the eighth or ninth inning. By that point, Cleveland could have already been behind had Francona gone to a less effective pitcher.
In the ALCS, Miller was brought into games twice in the seventh inning, once in the eighth, and once in the sixth. He was brought into Game 1 of the World Series in the seventh inning, then used in the fifth inning in Game 3 and again in the seventh inning of Game 4. In the must-win Game 7, Miller entered the game in the fifth inning.
Overall in the post-season, Miller was used three times in the fifth inning, twice in the sixth inning, four times in the seventh inning, and just once in the eighth inning. Francona used Miller when he was needed most and almost won the World Series with this strategy.
So what does this have to do with Trevor Hoffman? For starters, Hoffman was never used this way. He was used in the modern way, almost always during save situations and often with a three-run lead to start the ninth. He was used in situations when his team already had a great chance of winning the game. This type of usage limits the value a reliever can provide. That’s not his fault, but it is reality.
Hoffman Doesn’t Compare to HOF Starting Pitchers
When it comes to the Baseball Hall of Fame, I think it should be very difficult for a modern relief pitcher to gain entry. They just aren’t as valuable as a good starting pitcher. As a comparison, consider how Trevor Hoffman compares to a pair of starting pitchers currently on the Hall of Fame ballot, Curt Schilling and Mike Mussina. Below are the Baseball-Reference WAR (bWAR), FanGraphs WAR (fWAR), and an average of the two for these three pitchers:
82.7 bWAR, 82.2 fWAR, 82.5 avgWAR—Mike Mussina
80.7 bWAR, 79.8 fWAR, 80.3 avgWAR—Curt Schilling
28.0 bWAR, 26.1 fWAR, 27.1 avgWAR—Trevor Hoffman
Based on these two versions of WAR, Mussina and Schilling were significantly more valuable to their teams than Hoffman. They were more than three times as valuable. Despite this, Hoffman is currently polling the highest among the three on the publicly known Hall of Fame ballots that Ryan Thibodaux is tracking on Twitter @NotMrTibb.
@ 122 ballots/~28%:
Bagwell 93%
Raines 90%
Pudge 84%
Vlad 77%
Hoffman 73%
BB/RC 71%
Edgar 68%
Mussina 62%
Schill 52%https://t.co/PQK7gmI3NQ— Ryan Thibodaux (@NotMrTibbs) December 27, 2016
With 29.7 percent of the ballots counted, Hoffman currently has 71.3 percent, Mussina is at 63.6 percent, and Schilling is at 52.7 percent. The main reason for this is that Hoffman compiled over 600 saves. His high vote total is more about his usage pattern than about the value he provided to his teams.
Let’s go back in time to the late 1980s, before these pitchers started their major league careers. If you owned a major league team and you could be guaranteed that these three pitchers would do exactly what they did, which pitcher would you want for the next 20 years?
Mike Mussina—270 wins, 3.68 ERA, 3562.7 IP, 2813 K, 3.57 FIP
Curt Schilling—216 wins, 3.46 ERA, 3261 IP, 3116 K, 3.23 FIP
Trevor Hoffman—61 wins, 601 saves, 2.87 ERA, 1089.3 IP, 1133 K, 3.08 FIP
I’ll take either one of the two starting pitchers who threw more than 3,000 effective innings over a guy who pitched about one-third that amount. Give me the 200 IP, 4-5 WAR per season starting pitcher over the 60 IP, 1.5-2 WAR per season reliever. For me, it’s not even close. It would be much more difficult to find a Mike Mussina or Curt Schilling than a Trevor Hoffman. Give me the good starting pitcher and I’ll take my chances on finding a replacement at closer. Heck, on the current Hall of Fame ballot, give me Billy Wagner, who’s only getting 10.7 percent of the vote. The voters don’t consider him a Hall of Fame pitcher, but I’ll take him and get nearly the same value as Hoffman provided.
Starting pitchers who rank near Hoffman in Baseball-Reference WAR (around 28 WAR) include Jarrod Washburn, Jack McDowell, and Scott Sanderson. No one would consider those guys Hall of Fame pitchers.
When it comes to relief pitchers, Mariano Rivera is the greatest reliever of them all. He had 57.1 bWAR in his career, which is very close to Hall of Famers Willie Stargell (57.5) and Whitey Ford (54.3). Rivera is a legit Hall of Fame pitcher. He was twice as valuable as Hoffman without even considering his utter dominance in the postseason.
Hoffman Doesn’t Stand Out Among Other Closers
Some would argue that the bar should be set differently for closers than for starting pitchers. I disagree. Closer is not a position, like shortstop or catcher. Closer is a name that’s been invented for a certain role, like a LOOGY (Left-handed One Out Guy) or a setup guy. The position is pitcher.
But I’ll humor those who want to compare closers to closers. Even doing this, Hoffman doesn’t stand out. Based on Baseball-Reference WAR, he’s not as valuable as Tom “Flash” Gordon, John Hiller, and Lee Smith, among relievers. He’s barely more valuable than Billy Wagner and Joe Nathan. He was worth a couple more wins than Kent Tekulve. If you open the door for Hoffman, you might as well keep it wide open for another half-dozen relievers who are comparable in value. And when you do so, all of the relievers you put in will be among the lowest WAR players in the Hall of Fame.
Many Hoffman supporters point to his career save percentage as a reason to support his Hall of Fame candidacy, so let’s look at Hoffman compared to his contemporaries. Blown save data only goes back to 2002, so we’re limited to the last part of Hoffman’s career. Also, Hoffman only had 10 saves in his final season, so we’ll eliminate that year for his sake.
From 2002 to 2009, the following list shows the save percentages for pitchers in the ballpark of Hoffman who were used almost exclusively at closer (some closers were also setup men, so I eliminated pitchers with more than 20 holds over this stretch).
91.7%–Mariano Rivera
91.7%–Eric Gagne
91.1%–John Smoltz
90.2%–Trevor Hoffman
89.8%–Joe Nathan
89.3%–Jonathan Papelbon
88.1%–Troy Percival
87.9%–Bob Wickman
87.9%–Billy Wagner
Hoffman was good, no doubt, but not the best and certainly not significantly better than guys like Joe Nathan, Jonathan Papelbon, and Troy Percival. In a season with 40 save opportunities, the difference between Hoffman’s 90.2 percent save percentage and Wagner’s 87.9 percent is less than one save (0.92 saves).
Does Hoffman stand out in high leverage situations compared to other relievers with 300 or more saves? From Baseball-Reference.com, here are the High Leverage stats for the 11 relievers with 350 or more career saves:
.228/.279/.320, .599 OPS, 2567 PA—Mariano Rivera
.220/.281/.348, .629 OPS, 2259 PA—Trevor Hoffman
.250/.319/.365, .684 OPS, 2645 PA—Lee Smith
.205/.295/.319, .614 OPS, 1860 PA—Francisco Rodriguez
.254/.328/.332, .660 OPS, 2666 PA—John Franco
.202/.280/.318, .598 OPS, 1780 PA—Billy Wagner
.240/.284/.379, .663 OPS, 3151 PA—Dennis Eckersley
.200/.280/.312, .592 OPS, 1509 PA—Joe Nathan
.208/.269/.306, .575 OPS, 1451 PA—Jonathan Papelbon
.242/.306/.374, .680 OPS, 2197 PA—Jeff Reardon
.195/.292/.338, .630 OPS, 1517 PA—Troy Percival
In high leverage situations, Hoffman’s OPS allowed ranks sixth among these 11 pitchers. He was about as good in high leverage situations as Troy Percival. Percival got four votes last year.
Over time, the closer has attained an almost mythical status, like he has some innate ability to close out games that other pitchers don’t have. Trevor Hoffman spent most of his career with the Padres. His entrance was like a WWE wrestler, with “Hells Bells” playing on the loudspeaker as he walked in from the bullpen.
In his final three years with the Padres, Hoffman saved 46, 42, and 30 games, with a save percentage of 88.1 percent. When he left the Padres before the 2009 season, the Padres simply promoted setup guy Heath Bell to closer and Bell had 42, 47 and 43 saves over the next three years, with a save percentage of 90.4 percent. The Padres didn’t miss a beat.
Matt Kartozian-USA TODAY Sports
MLB Teams Don’t Value Closers Like Starters
One thing that’s true in most areas of life is that money talks. The modern day pioneer of baseball research, Bill James, wrote:
“One of the unwritten laws of economics is that it is impossible, truly impossible, to prevent the values of society from manifesting themselves in dollars and cents. This is, ultimately, the reason why we pay athletes so much money: that it is very important to us to be represented by winning teams. The standard example is cancer research; letters pop up all the time saying that it is absurd for baseball players to make twenty times as much money as cancer researchers. But the hard, unavoidable fact is that we are, as a nation, far more interested in having good baseball teams than we are in finding a cure for cancer.
That pool of money which we pour into athletics makes it inevitable that athletes are going to be better paid than cancer researchers. Dollars and cents are an incarnation of our values. Economic realities represent not what we should believe, not what we like to say we believe, not what we might choose to believe in a more perfect world, but what our beliefs really are. However much we complain about it, nobody can stop that truth from manifesting itself.”
(from The Mind of Bill James)
On a baseball level, this is apparent when you look at the contracts MLB teams have given to top closers over the years. If teams valued closers like they value top starting pitchers, we would see that in the contracts they give to closers. We don’t see that.
2007
4-years, $46 million, $11.5M/year—RP Francisco Cordero
4-years, $48 million, $12.0M/year—SP Carlos Silva
2008
3-years, $37 million, $12.3M/year—RP Francisco Rodriguez
4-years, $52 million, $13.0M/year—SP Ryan Dempster
2011
4-years, $50 million, $12.5M/year—RP Jonathan Papelbon
4-years, $58 million, $14.5M/year—SP Mark Beuhrle
2014
4-years, $46 million, $11.5M/year—RP David Robertson
4-years, $48 million, $12.0M/year—SP Brandon McCarthy
2016
5-years, $86 million, $17.2M/year—RP Aroldis Chapman
5-years, $80 million, $16.0M/year—RP Kenley Jansen
4-years, $62 million, $15.5M/year—RP Mark Melancon
3-years, $48 million, $16.0M/year—SP Rich Hill
1-year, $17.2 million, $17.2M/year—SP Jeremy Hellickson (qualifying offer)
2015 (starting pitchers for comparison to 2016 relievers)
5-years, $90 million, $18.0M/year—SP Jeff Samardzija
5-years, $80 million, $16.0M/year—SP Wei-Yin Chen
5-years, $80 million, $16.0M/year—SP Mike Leake
Over the years, MLB teams have valued the top relievers on the free agent market about the same as a #3 or #4 starter. This is true even for the recent record-setting reliever contracts for Aroldis Chapman and Kenley Jansen signed this off-season. Chapman and Jansen will be paid about as much as the oft-injured Rich Hill, who has pitched a total of 144.7 innings over the last three years (110.3 IP last year). Chapman and Jansen will make about what Jeremy Hellickson will make this year.
More from Call to the Pen
Their contracts are similar to contracts signed by Jeff Samardzija, Wei-Yin Chen, and Mike Leake last off-season. Nobody would clamor for Samardzija, Chen, or Leake to be in the Hall of Fame. This is an economic reality. Major league teams value Aroldis Chapman and Kenley Jansen, two of the best relievers in baseball, about the same as they value Jeff Samardzija or Wei-Yin Chen. If MLB teams value the top closers about the same as a mid-rotation starter, how can a modern closer be considered a Hall of Fame pitcher?